Data Analytics With Excel: Unlock Insights From Your Data
The Data Analytics With Excel course is designed to empower learners with the skills to transform raw data into meaningful insights using one of the most widely used tools in business today. Microsoft Excel is more than just spreadsheets — it is a powerful platform for data analysis, visualization, and decision‑making. This course provides a step‑by‑step guide to mastering Excel’s analytical features, making it ideal for students, professionals, and entrepreneurs.
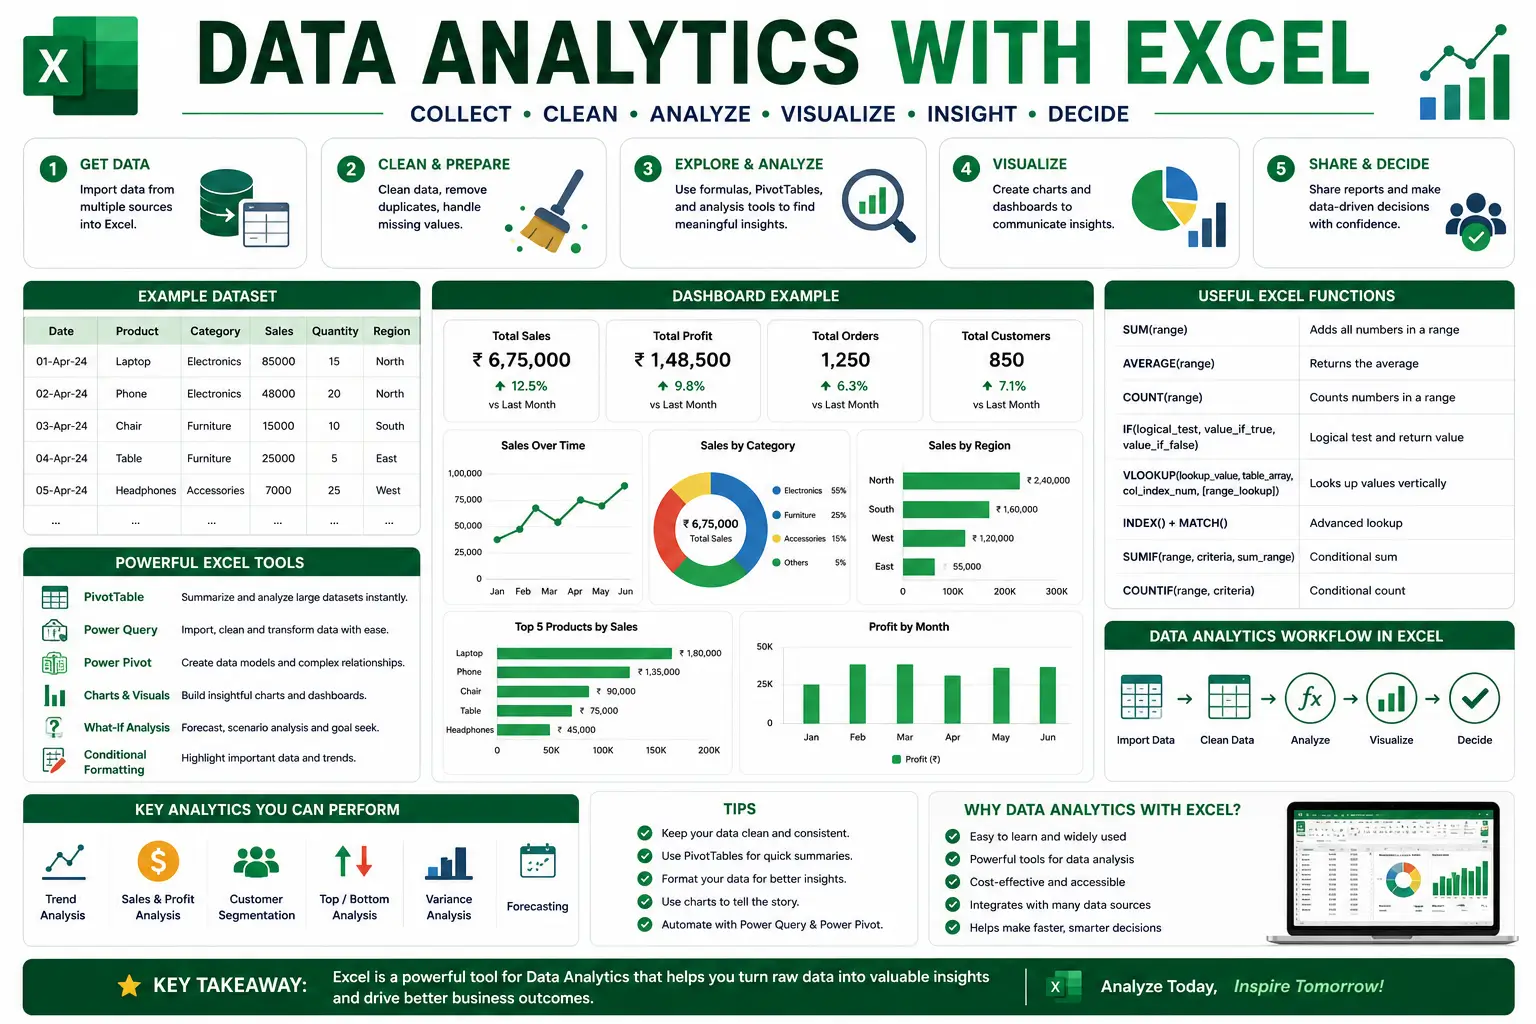
What You’ll Learn
- Excel Basics: Build a strong foundation in formulas, functions, and data organization.
- Data Cleaning: Learn techniques to prepare and structure datasets for analysis.
- Pivot Tables: Summarize and explore large datasets with ease.
- Data Visualization: Create charts, graphs, and dashboards to communicate insights effectively.
- Statistical Analysis: Apply descriptive statistics, regression, and forecasting tools.
- Advanced Excel Functions: Use VLOOKUP, INDEX‑MATCH, and array formulas for complex analysis.
- Automation With Macros: Save time by automating repetitive tasks.
Why This Course Matters
Data is the backbone of modern business decisions. By mastering analytics in Excel, you will:
- Gain confidence in handling large datasets.
- Improve accuracy and efficiency in reporting.
- Present insights through professional dashboards.
- Make data‑driven decisions in finance, marketing, HR, and operations.
Career Opportunities
Completing this course opens doors to roles such as:
- Data Analyst
- Business Intelligence Specialist
- Financial Analyst
- Operations Manager
- Reporting Consultant
- Enroll today to master Excel analytics and transform your career with practical, in‑demand skills.
FAQ SECTION
1. What is a Data Analytics with Excel Course?
It is a professional training program that teaches data analysis, visualization, dashboard creation, and reporting using Microsoft Excel.
2. Who should enroll in this course?
Students, professionals, MIS executives, business analysts, finance professionals, and aspiring data analysts can benefit.
3. Is this course suitable for beginners?
Yes, the course starts with Excel fundamentals before moving to advanced analytics concepts.
4. What skills will I learn?
Data analysis, PivotTables, dashboards, reporting, data visualization, and Excel functions.
5. Will I receive a certificate?
Yes, participants receive a course completion certificate.
6. Does the course cover PivotTables?
Yes, PivotTables and PivotCharts are covered extensively.
7. Will I learn dashboard creation?
Yes, learners build professional dashboards using Excel.
8. Are practical projects included?
Yes, the course includes hands-on assignments and real-world analytics projects.
9. Is the course available online?
Yes, learners can complete the course online.
10. What career opportunities are available after this course?
Data Analyst, MIS Executive, Reporting Analyst, Business Analyst, Operations Analyst, and Excel Specialist.


Reviews
There are no reviews yet.