Tableau Dashboard Skills: Transforming Data Into Interactive Insights
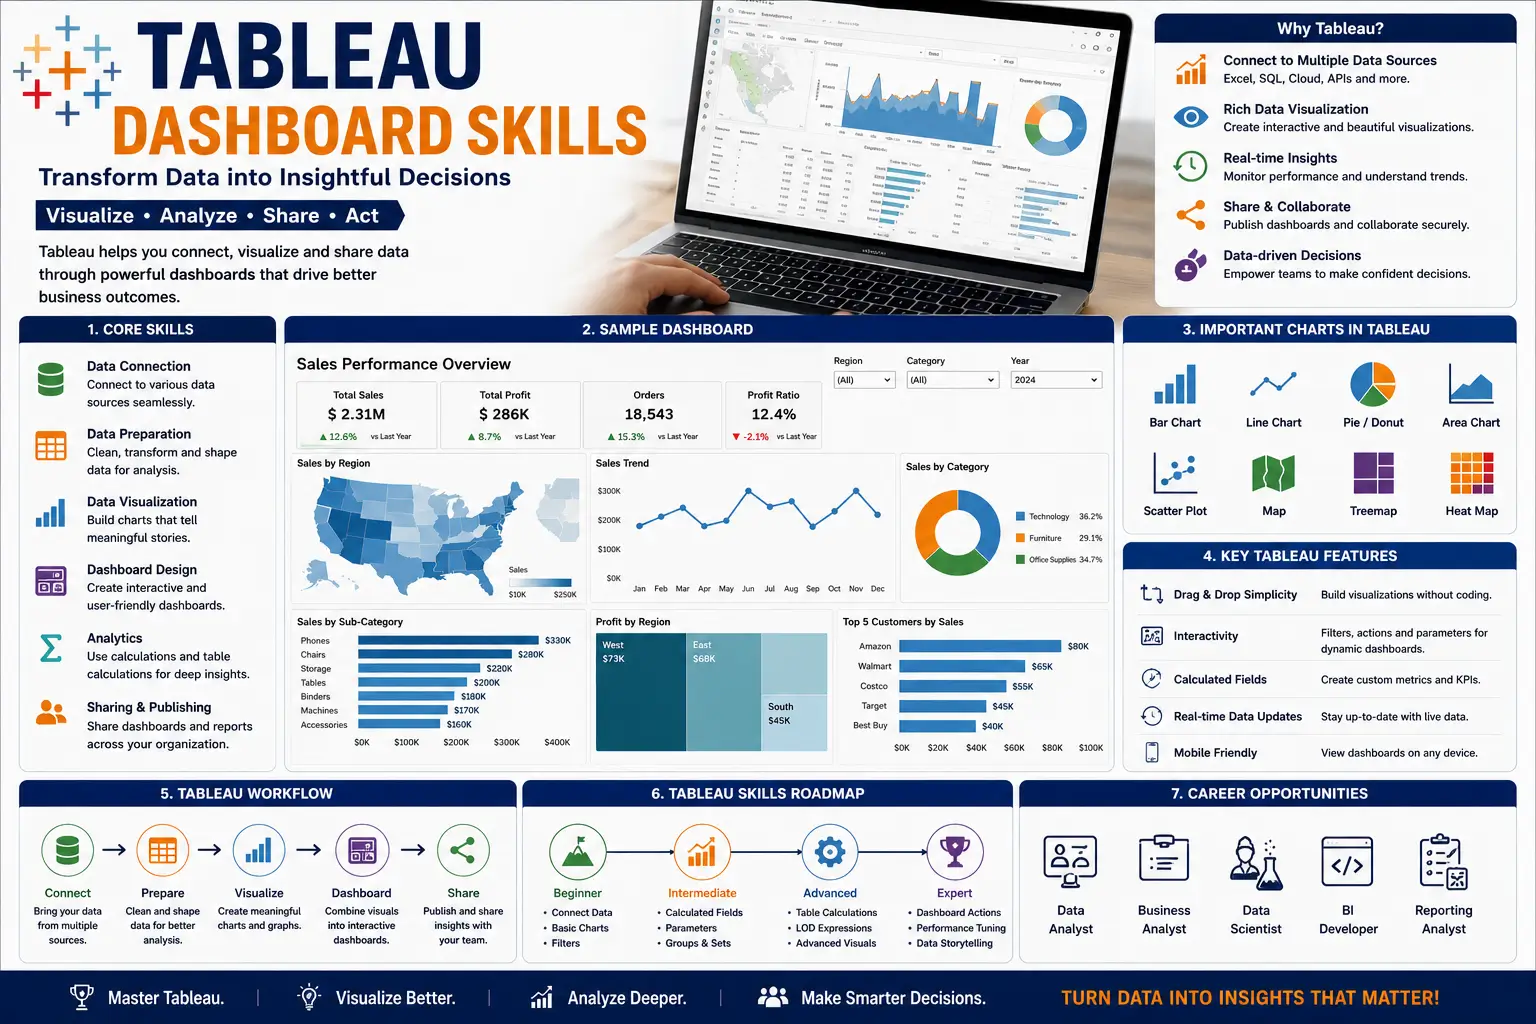
The Tableau Dashboard Skills course is designed to help learners master the art of building interactive dashboards that turn raw data into actionable insights. Tableau is one of the most powerful data visualization tools used worldwide, enabling professionals to analyze, present, and share information effectively. This course provides a step‑by‑step guide to creating dashboards that highlight KPIs, trends, and patterns for smarter decision‑making.
What You’ll Learn
- Tableau Fundamentals: Understand the Tableau interface, data connections, and visualization basics.
- Dashboard Design: Learn layout principles, interactivity, and storytelling with dashboards.
- Data Visualization: Explore charts, maps, and advanced visuals to represent data clearly.
- Filters & Parameters: Gain skills in creating dynamic dashboards with user‑controlled filters.
- Calculated Fields: Learn how to add custom calculations for deeper analysis.
- Interactive Features: Use actions, tooltips, and drill‑downs to enhance user experience.
- Publishing & Sharing: Discover how to publish dashboards online and share securely.
- Best Practices: Avoid common mistakes and ensure clarity, accuracy, and impact.
Why This Course Matters
In today’s data‑driven world, dashboards are essential for monitoring performance and making informed decisions. By mastering Tableau dashboard skills, learners will:
- Simplify complex datasets into clear visuals.
- Improve business reporting and presentations.
- Enhance collaboration with interactive dashboards.
- Build confidence in using Tableau for professional projects.
Career Opportunities
Completing this course opens doors to roles such as:
- Tableau Developer
- Business Intelligence Analyst
- Data Visualization Specialist
- Reporting Consultant
- Dashboard Designer
FAQ SECTION
1. What is Tableau?
Tableau is a leading business intelligence and data visualization platform used to create interactive dashboards and reports.
2. Who should enroll in this course?
Students, analysts, managers, IT professionals, marketers, and anyone interested in data analytics can benefit from this course.
3. Do I need prior Tableau experience?
No, the course is designed for beginners as well as professionals seeking advanced Tableau skills.
4. What will I learn in this course?
You will learn data visualization, dashboard creation, business intelligence reporting, data preparation, and Tableau best practices.
5. Does the course include practical projects?
Yes, learners work on real-world Tableau dashboard projects and business intelligence scenarios.
6. Will I learn interactive dashboard development?
Yes, creating interactive dashboards is one of the primary objectives of the course.
7. Is certification provided?
Yes, participants receive a certificate upon successful completion of the course.
8. Can Tableau skills help me get a job?
Yes, Tableau is widely used in analytics, business intelligence, and reporting roles across industries.
9. Does the course cover Tableau certification preparation?
Yes, the curriculum supports professional Tableau certification readiness.
10. What career opportunities are available after this course?
Career paths include Data Analyst, Business Analyst, BI Developer, Reporting Analyst, Tableau Developer, and Analytics Consultant.


Reviews
There are no reviews yet.