Power BI Dashboard Creation: Transform Data Into Actionable Insights
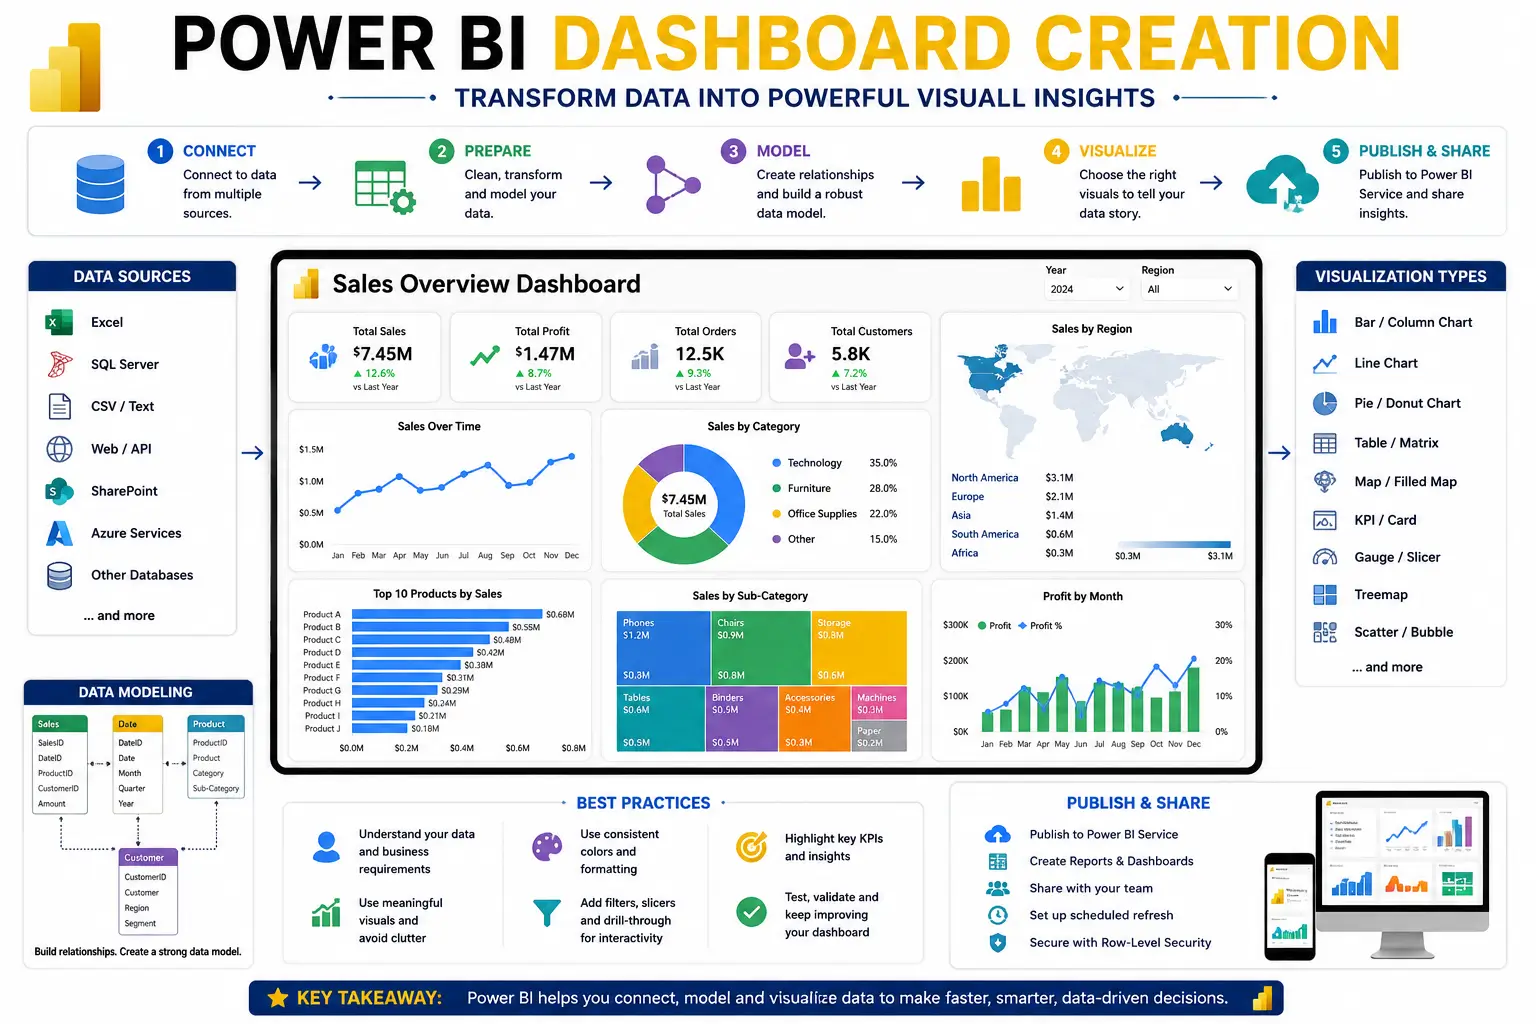
The Power BI Dashboard Creation course is designed to help learners master the art of building interactive, visually appealing dashboards that turn complex datasets into clear business intelligence. Microsoft Power BI is one of the most powerful tools for data visualization and reporting, and this course provides a practical, step‑by‑step approach to creating dashboards that drive smarter decisions.
What You’ll Learn
- Power BI Basics: Understand the interface, data connections, and workspace setup.
- Data Modeling: Learn relationships, measures, and calculated columns for accurate reporting.
- Data Transformation: Use Power Query to clean and prepare raw data.
- Dashboard Design: Create interactive visuals, charts, and KPIs.
- Advanced Visualizations: Explore maps, custom visuals, and drill‑through reports.
- Publishing & Sharing: Learn how to publish dashboards to the Power BI service and share with teams.
- Automation & Updates: Schedule refreshes and maintain live dashboards.
Why This Course Matters
In today’s data‑driven world, businesses rely on dashboards to monitor performance, identify trends, and make informed decisions. By mastering Power BI dashboard creation, you will:
- Present complex data in a simple, visual format.
- Improve collaboration by sharing dashboards across teams.
- Automate reporting processes to save time.
- Enhance decision‑making with real‑time insights.
Career Opportunities
Completing this course opens doors to roles such as:
- Business Intelligence Analyst
- Data Visualization Specialist
- Power BI Developer
- Reporting Analyst
- Data Consultant
FAQ SECTION
1. What is Power BI Dashboard Creation?
Power BI Dashboard Creation involves designing interactive dashboards that visualize business data and support decision-making.
2. Is this course suitable for beginners?
Yes. The course starts with basic concepts and gradually moves to advanced dashboard creation techniques.
3. Do I need coding knowledge?
No. Basic computer skills are sufficient to start learning Power BI.
4. What is DAX in Power BI?
DAX is a formula language used for calculations, measures, and advanced analytics in Power BI.
5. Will I work on real projects?
Yes. Practical exercises and dashboard projects are included.
6. How long does it take to complete?
The duration depends on your learning pace and course structure.
7. Is Power BI useful for data analytics careers?
Yes. Power BI is one of the most in-demand business intelligence tools globally.
8. Can I use Power BI in different industries?
Absolutely. Power BI is used in finance, healthcare, retail, marketing, and many other sectors.
9. Will I receive a certificate?
Yes, certification can be awarded upon successful completion.
10. What job roles can I apply for after this course?
You can pursue roles such as Data Analyst, Power BI Developer, Business Analyst, and Reporting Analyst.


Reviews
There are no reviews yet.